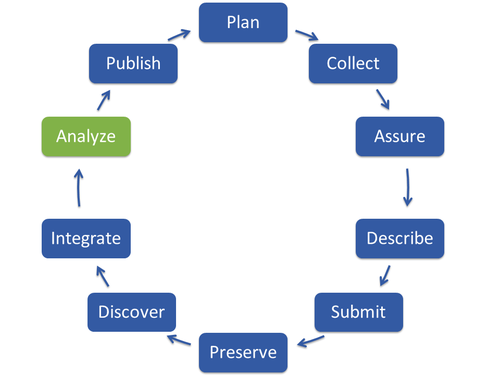
Analyze
What is it?
You analyse your data to gather information from a single or an integrated dataset. To analyse your data and use GFBio analysis tools, you have to upload your data. Then, they can be statistically explored through visualisation, overlay, transformation, statistical analysis or modelling. This set of actions should provide new insight into research questions, leading to conclusions that can help decision makers to act upon. Software and hardware used for data analysis, as well as data analysis
vary among disciplines.
Despite enormous differences in characteristics, quantity and format, research data from various scientific fields can be categorized in three basic types of data:
Raw Data: initial unprocessed data. Examples are measured data without corrections, photos or samples.
Primary Data: processed data. They can result from the conversion or correction of measurements. Other examples are specific data compilations or annotations.
Secondary data: Data are secondary data when they are re-used. These data were originally collected for a different purpose and used in a new context.
How to do it?
- Reproducibility is a crucial element for verification of results or for data reuse. Therefore, it is important to document the workflows of analysis and visualisation (e.g. computer scripts or text file notes).
- Be as detailed as possible when writing the process metadata! Which results are due to which step.
- Find appropriate software that is ideally open-source (e.g. R). Ask yourself what you want to find out and which tools you need. Which software has proven its worth in similar studies and fits best to your expertise and time budget?
- If pre-processing is required, state why. Normalize or transform raw data in meaningful values (algorithms).
- Describe how the algorithm is applied.
- Discover new patterns or outliers (in large datasets) via data mining and through plots (statistical or graphical output possible).
- Decide which statistical model fits the data best and perform your analysis.
Who does it?
Every kind of researcher dealing with biodiversity related data (data producers and data re-users).
Key Elements
- Careful documentation of analysis workflows (process metadata).
- Data analysis with appropriate visualization and analysis tools (data mining, descriptive statistics, graphical maps).
- Think about reproducibility!
GFBio Services
Data Visualization and Analysis
- GFBio VAT-System for visualization, aggregation and transformation
- Synthesis of heterogeneous spatio-temporal data sets, provision of added value services via a GIS-based interface for researchers
- Statistical exploration through visualization, overlay, transformation, statistical analysis or modelling
- Upload your own data and compare them with other datasets
Useful Links
https://kepler-project.org (Scientific workflow interface)
http://www.vistrails.org/index.php/Main_Page (Scientific workflow interface)
http://cran.r-project.org (R open-source software for statistics)
http://www.rstudio.com/products/rstudio/download (R Studio open-source tool for R)
Recommended citation:
German Federation for Biological Data (2021). GFBio Training Materials: Data Life Cycle Fact-Sheet: Data Life Cycle: Analyze. Retrieved 16 Dec 2021 from https://www.gfbio.org/training/materials/data-lifecycle/analyze.